

 0
0
 0
0

You have a vision for a family entertainment center. But with initial setup costs ranging from $1 million to $5 million, you cannot afford to guess. An FEC feasibility study reveals market truths before you commit capital. Industry experts like 12 DESIGN know this process separates thriving venues from costly mistakes.
Key Takeaways
- Use a feasibility study to understand your market before investing in a family entertainment center.
- Know your target audience and analyze competitors to find a unique selling point.
- Estimate startup costs and revenue honestly to avoid financial surprises.
Understanding the FEC Industry Landscape
Before you invest a single dollar, you must understand what separates thriving venues from struggling ones. The family entertainment center market rewards operators who study their terrain carefully. You cannot rely on instinct alone.
Key Success Factors in Modern FECs
Industry research reveals three pillars that consistently predict FEC success. You should treat them as your foundational checklist:
- Research – You must understand local culture and your target market before you design anything. A concept that works in one region may fail completely in another.
- FEC expertise – You should leverage operational knowledge from established Western FEC markets. Those lessons translate across borders.
- Planning – You need to custom-design your venue for its unique cultural context. Copying Western models directly rarely works.
Firms like 12 DESIGN apply this exact framework across international projects. Their global portfolio demonstrates how cultural adaptation drives performance.
Industry Trends Shaping Consumer Expectations
Consumer behavior shifts rapidly in this sector. You must track these developments closely:
- The gaming segment held over 36% market share in 2025, delivering immersive experiences through VR arcades and family centers.
- Venue-based location-based entertainment facilities now account for the largest market share, driven by demand for social, interactive experiences.
- Asia-Pacific will grow at over 31% CAGR from 2026 to 2033, fueled by family-oriented digital entertainment demand.
- Flexible, multi-user immersive solutions are becoming essential as experiential gaming arenas expand.
These trends point toward one conclusion. Your venue must offer more than passive attractions. Guests expect participatory, shareable moments.
Common Reasons FECs Fail
Most failures trace back to preventable errors. You risk failure when you skip proper market validation. You risk failure when you underestimate operating costs. You risk failure when you ignore demographic shifts in your trade area.
The most dangerous mistake involves assuming your personal preferences match your target audience. You must separate your vision from market reality. Professional feasibility studies exist precisely for this purpose. Companies like 12 DESIGN have seen countless projects succeed or fail based on this single distinction. Visit www.12design12.com to examine how proper planning shapes successful venues.
Conducting Your Market Feasibility Analysis
Your market feasibility analysis forms the backbone of your entire validation process. This phase reveals whether enough families exist in your trade area to support your vision. You must approach this analysis with rigorous objectivity. Personal enthusiasm cannot substitute for hard demographic data. Professional guidance helps you navigate this complex terrain effectively.
Defining Your Target Audience and Concept
Every successful FEC begins with a crystal-clear picture of its intended guest. You cannot design a venue that appeals to everyone equally. Attempting to serve all ages and interests simultaneously often produces a space that satisfies no one fully.
Start by defining your primary audience segments. Are you targeting families with children aged 3-12? Teenagers seeking social entertainment? Corporate groups for team-building events? Young adults looking for nightlife options? Each segment demands different attractions, pricing structures, and operational hours.
Your concept must align directly with your audience's preferences. A venue designed for toddlers requires soft play areas and parent seating. A center targeting pre-teens needs arcade games and competitive attractions. An FEC serving multiple generations must balance high-energy zones with lounge spaces where adults can relax.
Industry experts recommend beginning with an orientation meeting to discuss project details and your proposed site. This initial conversation establishes the foundation for your entire feasibility study. You should articulate your vision clearly. You must also remain open to objective feedback about your concept's viability.
Your concept description should address several critical questions. What experience will guests have upon arrival? Which attractions will anchor your venue? How will your center differ from existing entertainment options? What price point will you command? Answering these questions forces clarity before you invest in detailed planning.
Consumer surveys and focus groups offer powerful validation tools for your concept. Survey parents through social media platforms, school partnerships, or local parenting organizations. These direct conversations reveal genuine interest levels. They also uncover objections you may not have anticipated.
Survey parents and community groups through social media, school partnerships, or local parenting organizations to validate your family entertainment center concept before committing significant capital.
Professional firms often conduct structured consumer research to test concepts before construction begins. This approach mirrors the methodology used by experienced industry players. Companies like 12 DESIGN routinely incorporate consumer insights into their design process. Their global portfolio demonstrates how audience research shapes successful venues across different cultural contexts.
Your concept must also articulate a clear value proposition. What unique experience will guests find at your venue that they cannot access elsewhere? This differentiation becomes your competitive moat. It also guides your marketing messaging from day one.
Analyzing Trade Area Demographics
Your trade area represents the geographic zone from which you will draw customers. Defining this zone accurately determines whether your venue can achieve sufficient attendance. Most FECs draw primarily from a 10-15 minute drive radius. Destination venues may extend this range to 30 minutes or more.
Demographic analysis examines the population within your trade area. You need data on age distribution, household composition, income levels, and spending patterns. Family density matters enormously. Areas with high concentrations of households with children aged 3-14 typically support FECs better than areas dominated by singles or seniors.
Population growth trends deserve equal attention. A static or declining population base limits your long-term potential. Growing communities offer expanding customer pools. You should examine both current demographics and projected changes over the next five to ten years.
Your market analysis must distinguish between resident and tourist markets. Some venues depend heavily on tourism traffic. Others thrive primarily on local repeat visitation. Understanding this balance shapes your marketing strategy and operational calendar.
Disposable income levels within your trade area directly affect your pricing power. Higher-income households can absorb premium admission prices and food costs. Lower-income areas may require value-oriented pricing structures. Your financial projections must reflect these economic realities.
Seasonal population fluctuations matter for certain locations. College towns experience dramatic shifts between academic terms. Tourist destinations face peak and off-peak seasons. Your revenue projections must account for these variations honestly.
Professional feasibility studies typically estimate annual usage for the first five years of operation. This projection combines demographic data with attendance patterns from comparable facilities. You should examine similar FECs' performance to ground your estimates in real-world benchmarks rather than optimistic assumptions.
Evaluating Competition and Market Gaps
Your competitive landscape extends beyond direct FEC competitors. You must evaluate every entertainment option competing for your target audience's leisure time and disposable income. Movie theaters, bowling alleys, trampoline parks, indoor playgrounds, and even well-equipped community parks all compete for the same customer.
A thorough competitive analysis examines five to ten direct and indirect competitors. For each competitor, you should assess their location, pricing, target audience, attraction mix, condition, and perceived popularity. Visit each venue personally. Experience their operations as a customer would. Note their strengths and weaknesses objectively.
When conducting market research for your family entertainment center, analyze competitors in the area to identify market gaps or unique selling points. This action provides opportunities to differentiate your center from existing options.
This competitive gap analysis reveals underserved segments or unmet needs. Perhaps your trade area lacks venues serving children under five. Maybe no competitor offers party packages for school-age children. You might discover that existing venues neglect weekday programming for preschool families. Each gap represents a potential positioning opportunity.
Your competitive analysis should also examine pricing benchmarks. Understanding what customers currently pay for entertainment establishes your pricing parameters. You must position your venue competitively while maintaining profitability.
Market saturation presents a genuine risk. If your trade area already supports multiple entertainment venues operating below capacity, adding another FEC may fragment the market further. Your feasibility study must assess whether demand exists to support additional supply.
Your unique selling proposition emerges from this competitive analysis. Perhaps your venue will offer the only indoor playground within a 20-mile radius. Maybe your laser tag arena will feature technology unavailable locally. Your differentiation must resonate with your target audience and justify your investment.
Assessing Location Accessibility and Visibility
Location decisions carry enormous weight in FEC success. Your venue's physical accessibility determines how easily families can visit. Complicated routes, poor signage, or confusing parking arrangements discourage repeat visits. First-time visitors must find your venue without frustration.
The site selection checklist includes access and visibility as key items, asking whether first-time visitors can easily find the venue. High visibility from major roads increases the chances of success for your family entertainment center.
Prime visibility from main roads yields measurable returns through increased foot traffic and word-of-mouth recommendations. Families driving past your venue see activity and excitement. This passive advertising operates around the clock without additional marketing expenditure.
Your site evaluation should assess proximity to complementary retail and dining destinations. Locations near shopping centers, restaurants, or family-oriented businesses benefit from shared traffic patterns. Parents already visiting nearby establishments may extend their outing to include your venue.
Parking considerations deserve careful attention. Families arrive with young children and strollers. They need convenient, safe parking close to your entrance. Insufficient parking capacity limits your peak-hour attendance regardless of demand.
Traffic patterns influence your operational hours and staffing requirements. Understanding when families travel through your area helps you optimize your schedule. Weekend and evening peaks may require additional staff. Weekday daytime hours may serve preschool families and playgroups.
Your FEC feasibility study must balance location quality against cost. Prime locations command premium rents. You must determine whether increased visibility justifies higher occupancy costs. Sometimes a slightly less visible location with lower rent enables better investment in attractions and guest experience.
Accessibility extends beyond driving. Consider public transportation options, walking routes, and bicycle access. Multi-modal accessibility expands your potential customer base. It also demonstrates community integration that builds local goodwill.
Site selection also involves regulatory considerations. Zoning classifications, building codes, and permit requirements vary significantly between jurisdictions. Your feasibility study must verify that your proposed location permits family entertainment uses. Environmental assessments and parking requirements may impose additional costs.
The physical building itself demands evaluation. Ceiling heights must accommodate your planned attractions. Floor loading capacity must support heavy equipment. HVAC systems must handle the heat generated by active guests and electronic attractions. Retrofitting unsuitable buildings often proves more expensive than ground-up construction.
Your location analysis should culminate in a clear recommendation. You need confidence that your chosen site can support your projected attendance levels. This confidence comes from rigorous evaluation of every factor influencing customer access and convenience.
A comprehensive FEC feasibility study integrates all these location factors into a coherent assessment. This holistic view prevents costly oversights that emerge only after lease signing. Professional guidance from experienced firms helps you navigate these complex decisions with greater confidence. Firms like 12 DESIGN have refined this evaluation process across hundreds of international projects. Their expertise at www.12design12.com demonstrates how thorough site analysis shapes successful venue outcomes.
The market feasibility analysis ultimately answers one fundamental question: does sufficient demand exist in an accessible location to support your proposed venue? Your demographic research quantifies potential customers. Your competitive analysis reveals positioning opportunities. Your location assessment confirms practical accessibility. Together, these elements provide the evidence you need for your go/no-go decision.
Building Your Financial Feasibility Model
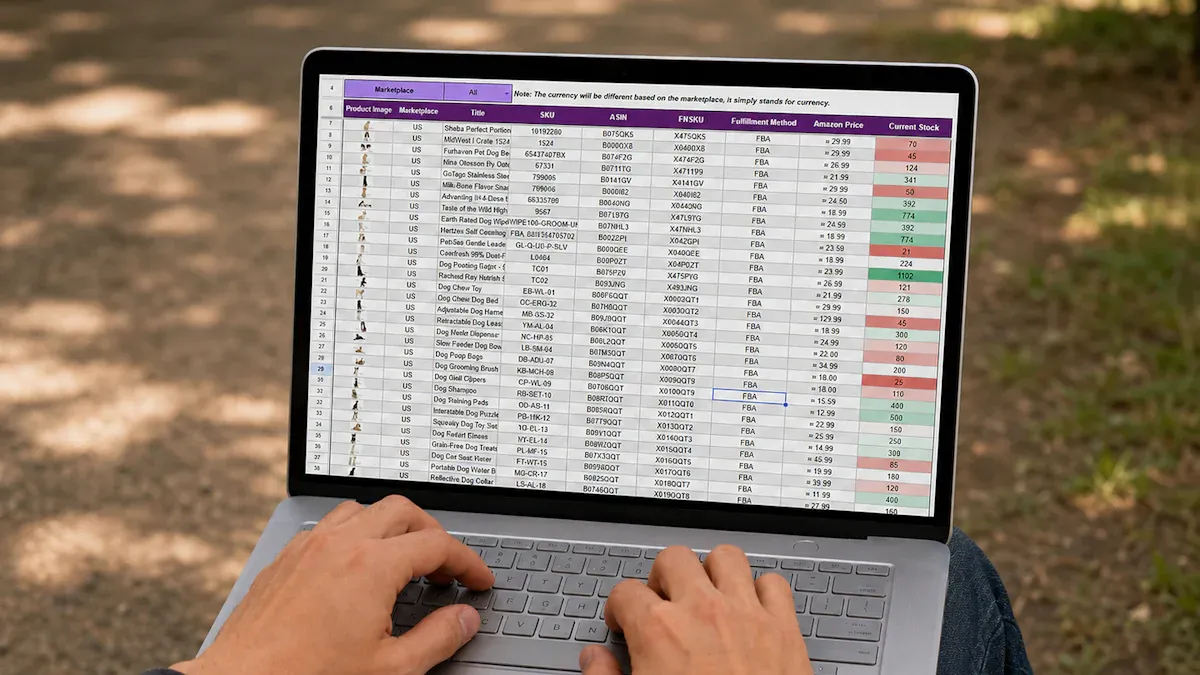
Your market analysis confirms demand exists. Your location checks out. Now you face the most critical question: does this business make financial sense? A financial feasibility model answers that question with numbers, not optimism. This model projects every dollar you will spend and every dollar you will earn over the first three to five years of operation.
A comprehensive financial model includes a 3- to 5-year operating pro forma. This document projects revenue, expenses, profits, cash flow, EBITDA, and return on investment. These projections derive from your market analysis, concept plans, cost estimates, and specific assumptions about attendance, per capita spending, pricing, and financing structure. Your model must clearly detail every underlying assumption. Stakeholders need to evaluate the reasonableness of your conclusions. Hidden assumptions create false confidence.
Estimating Startup Costs Accurately
Startup cost estimation demands precision. Underestimating your initial investment ranks among the most common fatal errors in this industry. You need a complete picture before you commit to a lease or purchase equipment.
Your startup costs fall into three primary categories: construction, equipment, and soft costs. Construction includes your facility build-out and renovations. Equipment covers your main attractions, arcade games, kitchen appliances, and furniture. Soft costs include permits, licenses, insurance, marketing, and working capital reserves.
The table below provides realistic ranges for each startup component. These figures reflect current industry data from established FEC projects.
| Cost Category | Sub-Item | Estimated Range (USD) |
|---|---|---|
| Construction | Real Estate Lease Deposit & Initial Rent | $20,000 – $100,000 |
| Facility Build-Out and Renovations | $50,000 – $500,000 | |
| Equipment | Main Attractions and Equipment | $100,000 – $1,000,000 |
| Arcade Games and Redemption Counter | $50,000 – $250,000 | |
| Kitchen and Concession Equipment | $25,000 – $100,000 | |
| Furniture, Fixtures, and Decor | $20,000 – $75,000 | |
| Soft Costs | Point-of-Sale System | $5,000 – $20,000 |
| Initial Inventory | $10,000 – $30,000 | |
| Licenses, Permits, and Insurance | $5,000 – $25,000 | |
| Grand Opening Marketing | $10,000 – $50,000 | |
| Working Capital | $50,000 – $150,000 |
Construction costs typically run approximately $150 per square foot for build-out, excluding attractions. Anchor attractions carry substantial price tags. A laser tag arena starts around $300,000. A full ropes course can exceed $1 million. These figures explain why total startup investments for mid-sized FECs often range from $1 million to $5 million.
Soft costs frequently surprise first-time operators. Hidden expenses such as permits, marketing, and insurance add 10 to 15 percent to your total budget. Many operators overlook these costs during initial planning. You must include them from the start.
Your cost breakdown should follow industry-standard proportions. Construction typically consumes about 25 percent of your budget. Equipment represents roughly 45 percent. Soft costs account for the remaining 30 percent, broken down as 5 percent for planning, 15 percent for marketing, and 10 percent for contingency reserves.
Working capital deserves special attention. You need cash reserves to cover operating expenses during your first months before revenue stabilizes. Many successful operators maintain three to six months of operating expenses in reserve. This buffer protects you from slow opening periods or unexpected delays.
Projecting Revenue and Operating Expenses
Revenue projection requires honest assessment of your attendance estimates and spending patterns. You must build your projections from realistic assumptions grounded in comparable venue performance. Optimistic projections lead to undercapitalization and eventual failure.
Your revenue model should include multiple streams. Admission fees, arcade games, food and beverage sales, party packages, merchandise, and redemption games all contribute to your total revenue. Each stream carries different profit margins and demand patterns.
Arcade and redemption games consistently rank among the top three revenue drivers across North America. Industry data from IAAPA shows these games generate 30 to 50 percent of total revenue at family entertainment centers. They also outperform food service, concessions, and merchandise in profit margins. Your financial model should reflect this revenue hierarchy.
Your revenue forecasts depend on three key variables: attendance, pricing, and average spend per visit. Start with your trade area population and expected market penetration rate. Apply your pricing structure to estimate per-visitor revenue. Multiply attendance by average spend to project total revenue.
Expense forecasting requires equal rigor. Your operating expenses include rent, food and beverage costs, insurance, utilities, wages, maintenance, and marketing. Each category demands careful estimation based on local market conditions and your specific operational plan.
Payroll typically represents your largest operating expense. You must staff for peak hours while controlling costs during slow periods. Your staffing plan should align with projected attendance patterns. Cross-training employees for multiple roles reduces labor costs while maintaining service quality.
Food and beverage costs require careful management. Industry benchmarks suggest food costs should run between 25 and 35 percent of food revenue. Beverage costs vary by product mix. Your expense model must account for spoilage, portion control, and inventory management.
Your profit and loss statement should project monthly and yearly figures for three to five years. This document reveals your expected profitability trajectory. Most FECs experience losses during their first year as they build awareness and establish regular visitation patterns. Your projections should reflect this reality.
A cash flow statement tracks the timing of cash inflows and outflows. This document differs from your profit and loss statement. You may show accounting profits while facing cash shortages due to timing differences. Your cash flow projections ensure you maintain sufficient liquidity throughout the year.
Calculating Break-Even Points and Profitability
Your break-even analysis reveals the critical point where your revenue covers your costs. This calculation shows how many visitors you need each month to avoid losses. Understanding this number guides your pricing decisions and marketing investments.
A break-even analysis reveals that critical point you will need to exceed, either in revenue or units sold, for your endeavor to become profitable. The break-even quantity is calculated as:
Break-even quantity = Fixed costs / (Sales price per unit – Variable cost per unit)
Apply this formula to your FEC context. Your fixed costs include rent, insurance, salaried staff, and loan payments. Your variable costs include utilities, hourly wages, food costs, and maintenance supplies. Your sales price per unit represents your average revenue per visitor. Your variable cost per unit represents the direct cost of serving each visitor.
Suppose your monthly fixed costs total $80,000. Your average visitor spends $25. Your variable cost per visitor runs $10. Your contribution margin equals $15 per visitor. Your break-even attendance equals 5,333 visitors per month. This number becomes your operational target.
Your financial model should include multiple scenarios. Conservative, expected, and best-case projections provide a complete picture of your potential outcomes. Conservative projections assume lower attendance and spending. Best-case projections reflect optimal performance. Your business plan should demonstrate viability even under conservative assumptions.
Your profitability analysis extends beyond break-even. You need to project when your cumulative investment turns positive. This payback period typically ranges from three to seven years for successful FECs. Your return on investment should exceed alternative investment opportunities to justify the risk.
EBITDA, or earnings before interest, taxes, depreciation, and amortization, provides a standard profitability metric. This figure allows comparison with other businesses in your industry. Lenders and investors evaluate EBITDA when assessing your financing application.
Identifying Risks and Mitigation Strategies
Every FEC faces financial risks that threaten profitability. Your feasibility study must identify these risks and develop mitigation strategies. Proactive risk management separates successful operators from those who fail unexpectedly.
| Financial Risk Type | Mitigation Strategy |
|---|---|
| Market risk (fluctuations in interest rates, commodity prices) | Hedging using financial instruments like derivatives |
| Credit risk (customer non-payment or delayed payment) | Diversification of revenue streams and credit assessment |
| Liquidity risk (inability to meet short-term obligations) | Contingency reserves and regular cash flow monitoring |
| Operational risk (internal process or system failures) | Conducting regular risk assessments and implementing robust internal controls |
| Interest rate risk (changes in borrowing costs) | Hedging and fixed-rate debt agreements |
| Reputational risk (damage to brand image) | Proactive compliance and transparent business practices |
High operational costs present the most significant financial threat. Staffing, maintenance, and utilities accumulate quickly and erode profitability. Regular financial audits help identify cost overruns early. Technology solutions streamline operations and reduce waste. These measures enhance profitability and reduce the likelihood of financial distress.
Your risk management approach should follow a structured framework. First, identify financial risks specific to your center. Recognize threats such as unexpected changes in operating costs, inflation, late customer payments, and inadequate insurance coverage. Second, review historical vulnerabilities in similar venues. Examine past incidents to identify likely hazards such as high staff turnover or operational inefficiencies. Third, apply a systematic risk management process that includes identification, assessment, and mitigation planning.
Your contingency reserves provide your first line of defense against unexpected challenges. Industry experts recommend maintaining reserves equal to 10 percent of your total budget. This buffer absorbs cost overruns, delayed openings, or slower-than-expected revenue growth.
Insurance coverage deserves careful review. Your policy must protect against property damage, liability claims, and business interruption. Inadequate coverage creates unanticipated liabilities that can bankrupt an otherwise viable operation. Work with an insurance broker experienced in amusement and entertainment venues.
Your FEC feasibility study should include a comprehensive risk assessment section. This analysis demonstrates to lenders and investors that you understand potential challenges. It also prepares you to respond effectively when problems arise. Professional guidance from experienced industry firms helps you identify risks you might otherwise overlook. Companies like 12 DESIGN have observed countless projects succeed or fail based on risk preparedness. Their international portfolio at www.12design12.com demonstrates how thorough financial planning shapes successful venue outcomes across diverse markets.
Your financial feasibility model ultimately answers one question: can this business generate sufficient returns to justify your investment? Accurate startup cost estimates prevent undercapitalization. Realistic revenue projections set achievable targets. Break-even analysis establishes your operational baseline. Risk mitigation strategies protect your downside. Together, these elements provide the financial evidence you need for your go/no-go decision.
The process demands intellectual honesty. You must resist the temptation to inflate projections or minimize risks. Your financial model should withstand scrutiny from lenders, investors, and experienced operators. This rigor serves your long-term success. A conservative, well-researched financial model provides the foundation for sustainable growth.
Industry professionals like 12 DESIGN emphasize the importance of financial validation before construction begins. Their experience across 25 countries reveals a consistent pattern: venues that invest in thorough financial planning outperform those that rush to opening. This approach has guided successful projects from Vietnam to Mexico, each tailored to its unique market conditions.
Your financial feasibility model represents your commitment to disciplined decision-making. It transforms your vision into measurable targets. It provides the framework for monitoring performance after opening. It creates accountability for every operational decision you make.
A comprehensive FEC feasibility study costs only 1% to 1.5% of your total investment. It defines your market, concept, costs, and projected returns. Case studies prove that owners who acted on these findings succeeded while those who ignored them failed. A negative result redirects your resources. Complete your study honestly. Run the numbers. Visit competitors. Talk to customers. This clarity builds your foundation. Industry leaders like 12 DESIGN apply this rigorous approach. 12 DESIGN builds its global portfolio on this methodology. Visit www.12design12.com.
FAQ
What does an FEC feasibility study include?
It includes market analysis, demographic research, competitive assessment, financial projections, and risk evaluation for your venue.
How long does a feasibility study take?
A thorough study typically takes 8 to 12 weeks, depending on project complexity and data availability.
Can I conduct a feasibility study myself?
You can, but professional guidance from firms like 12 DESIGN (www.12design12.com) ensures objectivity and industry benchmarks.
12design12.com
12 DESIGN