
 0
0
 0
0

The US FEC market will reach roughly $27 billion by 2027, per Grand View Research's 2024 estimate of $18.5 billion (10.2% CAGR). National growth won't set your ROI. Families, children, and qualified households within a practical drive time do. Can they justify your construction budget and target return? That question shapes every 12 DESIGN build.
Key Takeaways
- National market forecasts provide context only. Success depends on your local trade area, not the $27 billion projection.
- Measure household income, child density, competitor supply inside your drive-time polygon before choosing a site.
- Use published operator benchmarks to set revenue goals. Run five pass/fail tests; one failure means walk away.
The 2027 US FEC market number
The US FEC market will reach roughly $27 billion by 2027. Grand View Research reported a 2023 baseline of $18.5 billion. The implied compound annual growth rate is 10.2%. You will see that figure in nearly every investor deck released this year.
The national number acts as a signal. It tells lenders, developers, and franchise operators that the category is expanding. It also indicates which direction the industry is moving. But it cannot tell you where to build.
The number investors ask for
When investors ask for the national market size, they rarely ask for a full report. They want one line that validates a decision. The $27 billion projection does that. It separates family entertainment from stagnant retail categories. It puts the sector inside the broader experience economy.
That familiar figure, however, hides almost everything you need.
The national number averages fast-growing metros with slow-growing rural regions. It blends high-income suburbs with lower-income districts. It counts every format, from a 1,500-square-foot arcade to a 100,000-square-foot family destination. None of that variation appears in one grand total.
| What the national number gives you | What it cannot give you |
|---|---|
| Confidence that the category is expanding | Confidence that a specific site will perform |
| A benchmark for franchise underwriting | A trade-area population count |
| A context for comparing regions | A drive-time child count |
| A quick answer for a board meeting | A competitor supply assessment |
Do not treat this table as proof that macro data has no value. Use it to define what macro data can and cannot do. The national figure works for industry reports, partnership pitches, and high-level comparisons. It fails the moment you ask about your site.
The real question starts where the national number stops. Can families within a practical drive time of your proposed site generate enough revenue to cover construction costs and hit your target return? That question requires trade-area analysis, not macro statistics.
Growth-rate assumptions
The 10.2% growth assumption rests on a few observable trends.
- Demographics: The Census Bureau expects the US child population under 14 to stay above 54 million through the end of the decade. Millennial and Gen Z parents treat shared experiences as a core part of family spending. They favor birthday parties, weekend outings, and activity-based play over toys and screen time.
- Experience spending: Consumers keep shifting dollars from physical goods to services. Live entertainment, dining, and play capture a growing share of disposable income. Personal consumption data has shown this shift for two decades.
- Franchise expansion: Multi-unit operators continue to enter mid-sized metros. A new location raises category-wide average revenue as it matures. National brands such as Dave & Buster's and Puttshack use this playbook to grow square footage quickly.
- Design innovation: New venues integrate digital sports, immersive themes, and food-and-beverage programs. These formats extend visit duration and lift average spend per visitor. They also generate organic social-media exposure that lowers customer-acquisition costs.
These assumptions hold in the aggregate. They do not hold automatically in every town. A metro with a shrinking child population can still post a negative growth rate while the national market grows. A county with three competing family entertainment centers can hit saturation before the next facility opens.
Also remember that 10.2% is a nominal rate. Construction costs, insurance, and wages carry their own inflation. If input costs rise faster than ticket prices, real profit growth may lag the headline number. A sound financial model should separate revenue growth from cost inflation.
The growth rate you should care about is the one inside your own trade area.
No national growth rate tells you whether a family inside your drive time will buy a ticket.
This is where the national projection becomes a design problem. You need to turn demand into square footage, attraction mix, operating costs, and ticket pricing. That work requires a team that understands both market sizing and physical construction. Firms like 12 DESIGN use an integrated design-build process that starts with a site survey and ends with a fully constructed facility. Their approach ties local market evidence to a build program. You can review examples of that process at www.12design12.com.
Do not mistake the national number for local demand. The $27 billion forecast is context. Your site's drive-time population, household income, and competitor supply are the real decision inputs. Start with the national data if it helps frame the conversation. Then move quickly to the local math that protects your capital. A partner such as 12 DESIGN can help you translate that local math into a facility that matches actual demand.
Why FEC estimates disagree
Analysts rarely define a family entertainment center the same way. Those definition gaps shift the US FEC market size by billions. You cannot rely on a single headline number.
What counts as an FEC
Market researchers use NAICS Code 713990-01. It classifies family entertainment centers as indoor or outdoor facilities with mixed attractions. The category spans far more formats than you might imagine:
- Indoor play spaces: indoor playgrounds, children's play centers, activity centers
- Active recreation: trampoline parks, laser tag arenas, go-kart tracks, mini-golf courses, bowling alleys, water parks, adventure parks
- Amusement-style venues: amusement parks, entertainment complexes, family fun centers, entertainment destinations
- Arcade and game venues: arcade centers, game centers, fun zones, party venues, recreational facilities
Industry reports also treat Family Entertainment Centers as a distinct segment in the Indoor Entertainment Center Market. They sit alongside Amusement Parks, Trampoline Parks, and Laser Tag Arenas. That segmentation gives analysts room to include or exclude whole categories.
This flexibility creates wide-ranging estimates. One report may count a trampoline park as an FEC. Another categorizes it separately. A 2,000-square-foot arcade and a 50,000-square-foot water park can land in the same total. Your site's actual mix determines your revenue, not the classification scheme an analyst chose.
The capital-planning consequence
Definition disagreement becomes capital risk. You cannot size a build from an average pulled across mixed facility types. You need a local revenue model tied to your exact attraction mix. This is where an integrated design-build approach matters. Firms like 12 DESIGN combine market analysis with construction planning, so your budget matches your trade area.
Treat every published estimate as a range, not a fact. Then test your site against local demand before you commit capital. To see how a design-build team translates market evidence into a facility, review 12 DESIGN's process at www.12design12.com.
What operator data says about real ROI
National market size hides the unit-level math that protects your capital. Public operator data gives you realistic benchmarks for revenue, investment, and operating mix. Use these numbers to pressure-test your own project.
Dave & Buster's revenue mix
Dave & Buster's splits its revenue between amusement and food-and-beverage. Entertainment generates repeat visits. F&B drives ticket size. Their public filings show a roughly even split across both lines. That balance supports larger square footage. Each department carries its own profit center. Your build mix should reflect drive-time demographics. A location with more families shifts toward entertainment. A metro with young adults shifts toward F&B. The lesson from their model: diversify revenue streams across two distinct profit pools.
Altitude unit economics
Altitude Trampoline Park's 2024 FDD provides a useful benchmark:
| Metric | 2024 Value |
|---|---|
| Initial investment range | $2,225,000 – $3,258,500 |
| Average annual unit revenue | $2,114,975 |
That revenue figure covers rent, payroll, insurance, and amortized construction costs. Compare it against your trade-area projection. The gap between that $2.11M average and your proposed build cost determines your payback period. You should not rely on optimistic industry averages. Firms like 12 DESIGN anchor their pro formas to published data like this.
2027 trends that change the mix
Digital sports, VR simulators, and immersive themed zones push average spend higher. These formats extend the average visit from two hours to four. F&B programs convert longer stays into higher checks. This trend changes your square-footage allocation. High-engagement zones take a larger share of the floor plan. Firms like 12 DESIGN use operator benchmarks to translate these ratios into construction drawings. Their integrated design-build process ties local demand data to a build program. You can see case examples at www.12design12.com.
Size your local US FEC market before choosing a site

The $27 billion projection for the US FEC market settles industry debates about category growth. It answers nothing about your specific site. Your trade area decides your return. Sizing that local market requires three separate analyses: household income potential, drive-time child counts, and competitor supply. Each one feeds your square footage, your attraction mix, and your construction budget. Skipping any of them invites capital risk.
The national forecast validates the industry. Your trade-area math validates your site.
Trade-area population and income
Begin with your trade area. Define it as a drive-time polygon, not a city limit line. A typical FEC draws most visitors from a 20-30 minute drive in suburban markets. Dense metros compress that radius to 15-20 minutes. Families accept a longer commute for a weekend destination. They will not traverse an entire metro for a routine afternoon visit.
Build your drive-time polygon with mapping software that measures travel time, not straight-line mileage. Google Maps and ESRI ArcGIS both offer drive-time analysis. Overlay population data from the American Community Survey. That survey provides block-group-level counts, giving you the granularity to capture local concentration. Municipal boundaries hide the distribution that matters.
Population totals form your base layer. Household income performs the real work.
Higher-income households drive FEC spending. A family earning $60,000 per year might visit once each quarter. A household earning $150,000 visits monthly. Your venue needs enough affluent households to hit its weekly visit target. Pull the count of households earning $75,000 or more inside your polygon. That threshold aligns with current consumer spending patterns for family entertainment.

Apply a capacity check to the result. Divide your high-income household count by the weekly visitors your revenue model requires. The quotient reveals the necessary penetration rate. A figure below 0.5 households per required weekly visit warns of thin demand. A figure above 1.5 signals expansion headroom. Successful single-site operators typically target ratios between 0.8 and 1.2.
Document these assumptions in your feasibility study. A single percentage point shift in household penetration changes your monthly revenue projection by thousands of dollars. Clarity here prevents downstream surprises.
Drive-time child counts
The second analysis focuses on your core customer: children aged 4 to 14. Count them inside your drive-time polygon. These children determine the family's outing decision. Their parents choose the destination, but the kids provide the motivation. A household with two children spends roughly double what a childless couple spends at your venue.
Pull child population by age cohort from the American Community Survey. Create two cohorts: ages 4-9 and ages 10-14. Review the 10-year population projection from your state's demographic agency. A flat or growing child population supports your investment case. A declining birth-rate county creates a market headwind you cannot design around.
Child density carries as much weight as absolute count. Five hundred thousand children spread across 3,000 square miles cannot sustain a destination FEC. The same number packed into a 15-mile radius can support multiple venues. Compare children per square mile across your candidate sites. Choose density over raw numbers every time.

Run the seat-math test after gathering child counts. Estimate your facility's weekly visitor capacity. Multiply your guest area by average throughput per square foot. Then divide by your projected visit length of 2.5-4 hours. Compare that weekly capacity with your trade-area child population. Suppose your facility needs 4,000 weekly visitors. Your trade area holds 10,000 children. That scenario demands a 40% penetration rate. That rate exceeds realistic expectations. Most FECs reach 10-15% of their total child population.
Competitor supply and facility constraints
The third factor measures supply. Every competing venue inside your polygon draws from the same family leisure budget. Inventory that supply before you commit to a location.
Visit each competitor during peak weekend hours. Note their square footage, attraction lineup, pricing, and visible occupancy levels. Build a supply table with facility names, formats, sizes, and estimated attendance. Sum the totals. Divide combined square footage by your trade-area child population. The resulting supply-per-child ratio indicates whether additional FEC capacity makes sense.
| Competitor | Format | Square feet | Est. weekly visitors |
|---|---|---|---|
| Riverside Fun Center | Trampoline park | 28,000 | 4,100 |
| Main Street Arcade | Arcade + redemption | 9,500 | 2,300 |
| Summit Lanes | Bowling + F&B | 38,000 | 3,900 |
Include planned projects in your count. Commercial brokers know which pads carry signed amusement tenants. Incorporate those future competitors into your supply calculation.
Physical constraints operate independently of market spreads. A site with perfect demographics fails when the building cannot fit your program. Check ceiling height first. Trampoline parks and multi-level play structures require 18-24 feet of clear height. Standard tilt-up retail buildings often offer only 16-18 feet. That gap eliminates certain attractions or forces costly structural retrofits.
Column spacing follows ceiling height. A wide-open floor plan allows flexible arcade clusters and clear sightlines. A column grid on 20-foot centers breaks your layout into awkward bays. You waste square footage on circulation and dead corners.
Zoning requires its own permit check. Amusement uses sometimes demand special conditional use permits. Some municipalities cap operating hours, restrict outdoor signage, or impose noise limits. Verify that your intended attraction mix qualifies as an allowed use before you pay for schematic design. A variance process adds four to eight months of schedule risk.
Parking completes the constraint set. Plan one parking space per 150-250 square feet of guest area. F&B-heavy formats need more parking than arcade-only venues because dining customers linger. A restrictive parking covenant can cap your attendance before your doors open.
Run these three analyses in sequence. Each one filters out a bad site. Trade-area income rules out thin markets. Child counts rule out aging suburbs. Competitor supply rules out saturated highways. Physical constraints rule out affordable-looking buildings that require expensive adaptation.
This local sizing process determines everything downstream: your square footage, your entertainment-to-F&B ratio, your staffing model, and your ticket pricing. A design-build approach translates those findings directly into construction documents. Firms like 12 DESIGN connect local market evidence to a physical building. Their integrated process moves from site survey through construction management. You can review completed FEC projects at www.12design12.com.
The national number frames the conversation. Your local market determines the outcome. Ask a partner such as 12 DESIGN to translate your measured demand into a coherent building program. That sequence - measure, model, build - protects your capital before you break ground.
Turn local demand into a build program
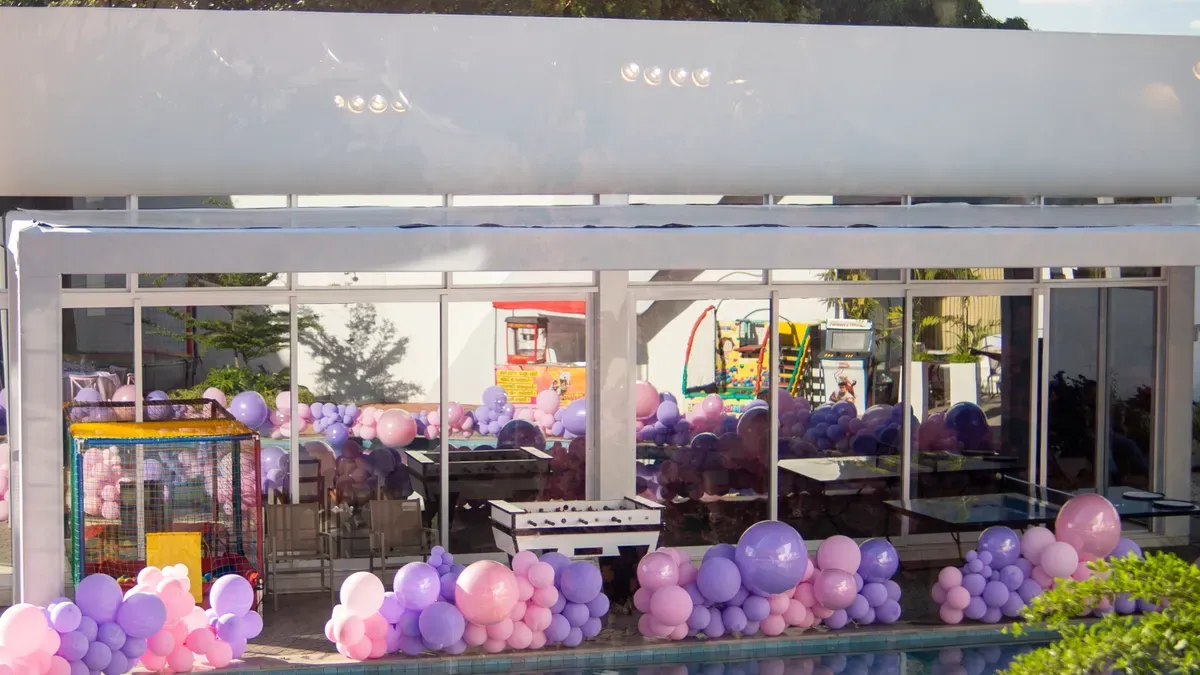
Your revenue target dictates your building size. Industry benchmarks range from $150 to $250 in revenue per square foot for mixed FEC formats. Divide your target by that figure. A $2.5 million revenue goal requires 10,000 to 16,000 square feet. High-engagement zones like trampolines and laser tag produce more per foot. Arcade space produces less.
From revenue target to square footage
Run the calculation with the lower benchmark first. This ensures your floor plan covers fixed costs. Use the upper benchmark only for upside scenarios. The gap between the two becomes your design flexibility. A smaller building with a tighter mix often beats a larger building with wasted corners.
Entertainment-to-F&B mix
Your trade-area demographics set the ratio. Family-dominated markets need more entertainment square footage. Adult-leaning markets require a stronger dining program. A 70/30 entertainment-to-F&B split works for most suburban family locations. Entertainment drives visits; F&B drives ticket size. Build both profit pools into the floor plan.
| Segment | Build cost/sq ft | Revenue split |
|---|---|---|
| Entertainment | $150–$250 | 60–70% |
| Food & beverage | $350–$500 | 30–40% |
F&B costs more to build. It also returns higher margins and extends dwell time. Design the kitchen and bar around your projected check average.
Operating cost model
Labor represents 30–35% of revenue. Rent lands between 10–15%. Insurance and maintenance consume 8–12% combined. F&B cost of goods runs 25–30% of that department's sales. Stack these lines against your revenue-per-square-foot figure. Firms like 12 DESIGN build their construction budgets from these ratios.
If operating costs exceed 80% of projected revenue before debt service, your target return is too thin.
Most new FECs take 12 to 18 months to reach maturity. Design your staffing and inventory plans around that ramp. A partner like 12 DESIGN translates these operating assumptions into floor plates, engineered systems, and construction drawings. Their integrated design-build process keeps your financial model front and center at every stage. See how that works at www.12design12.com.
The yes/no checklist before you build
Before you commit capital, run five pass/fail tests. Each one protects your downside. If any fails, walk away.
Five pass/fail market tests
- Trade-area income: Count households earning $75,000 or more inside a 20-minute drive. If you cannot reach 0.8 per required weekly visitor, fail.
- Child density: Count children ages 4–14 inside that polygon. Density matters more than raw numbers. You need about 6,000 children per 10,000 square feet of guest area.
- Competitor supply: Map every competing venue within your drive time. Sum their square footage. Divide by your trade-area child population. If supply per child exceeds the regional average, fail.
- Physical constraints: Confirm 18–24 feet of clearance, wide column spacing, and one parking space per 200 square feet. Miss one constraint, and retrofit costs erase your margin.
- Zoning and permits: Verify amusement use is allowed as-of-right. Conditional permits add months. If approval pushes opening past 18 months, fail.
Four passes justify deeper modeling. One failure kills the location. No design can fix a thin market.
Designing after sizing, not before
Design follows sizing. Once the five tests pass, translate local demand into a building program. Revenue target sets square footage. Attraction mix sets ceiling heights. Operating margins set construction cost. This sequence protects capital. For example, 12 DESIGN uses an integrated design-build model that starts with local evidence and ends with construction drawings. You can review their planning process at www.12design12.com. The order matters: size the market, then hire a design partner. A partner like 12 DESIGN turns your trade-area data into a buildable facility.
The 2027 US FEC market grows at a steady pace, but national momentum does not guarantee local success. You should use published estimates for context, operator data for ROI benchmarks, and trade-area analytics for your sizing decision. This method produces a build program matched to demand. Firms like 12 DESIGN turn that evidence into a facility that protects your capital before you break ground.
FAQ
These answers address the questions investors and developers ask most frequently after running the local sizing process.
How much capital does a new FEC require?
Altitude's FDD shows a $2.2M to $3.3M initial investment. Your budget depends on trade-area demand, square footage, and mix. Firms like 12 DESIGN anchor pro formas to published data.
What drive time should I use for a trade-area analysis?
Dense metros use a 15-20 minute drive polygon. Suburban markets reach 20-30 minutes. Model demand with mapping software, then overlay household income and child density. See examples at www.12design12.com.
How should I handle competitor saturation?
Competitor saturation strains attendance projections. A supply-per-child ratio above the regional average means a pricing war. Walk away. 12 DESIGN's disciplined approach prevents you from building on a saturated site.
See Also
Always Select The Proper Aluminum Casting Process The Next Time
12design12.com
12DESIGN